
Exam2pass
0 items Sign In or Register
  • Home
  • IT Exams
  • Guarantee
  • FAQs
  • Reviews
  • Contact Us
  • Demo
Exam2pass > IIBA > IIBA Certifications > CBDA > CBDA Online Practice Questions and Answers

CBDA Online Practice Questions and Answers

Questions 4

A Human Resource manager recently learned that their competitor reduced employee attrition rates by 20% after implementing personality tests as part of their screening process. Intrigued by the idea, the manager suggests collecting data on personality tests and attrition rates over the next year. The data from this year is then analyzed to explore possible relationships. What type of analytics has the team been asked to perform?

A. Predictive

B. Descriptive

C. Prescriptive

D. Diagnostic

Buy Now

Correct Answer: B

Descriptive analytics is a type of analytics that summarizes and visualizes the data to provide an overview of what has happened or is happening, such as the attrition rates and the personality test scores of the employees12. The team has been asked to perform descriptive analytics to explore possible relationships between the data variables, without making any predictions or prescriptions for the future.

Questions 5

After analyzing sales data, the analytics team finds that the older the customer, the more expensive the neckties purchased. The team felt this was a breakthrough insight but on closer analysis realized that other factors could account for this relationship. This is a clear indication that:

A. Correlation between variables implies causation

B. Causation has no relationship with correlation

C. Causation between variables does not imply correlation

D. Correlation between variables does not imply causation

Buy Now

Correct Answer: D

The analytics team found a correlation between the age of the customer and the price of the neckties purchased, meaning that as one variable changes, the other tends to change in the same direction. However, this correlation does not imply causation, meaning that one variable does not necessarily cause the other to change. There could be other factors, such as income, preference, or quality, that affect both variables and create a spurious relationship. Therefore, the team realized that they need to investigate further to determine if there is a causal link between the variables, or if the correlation is coincidental

Questions 6

Operation managers are concerned about the increasing attrition rates in the call center. A series of interviews is being conducted with call center agents to collect information to better understand the problem. Interviewees will ask open and closed ended questions that are both quantitative and qualitative. Which of the following is considered a qualitative open-ended question?

A. How does call volume contribute to job burnout?

B. Would morale improve if you could work 2 days per week from home?

C. How many calls on average do you service in an hour?

D. Do you receive more calls on Mondays or Fridays?

Buy Now

Correct Answer: A

A qualitative open-ended question is a question that allows the respondent to express their thoughts, feelings, or opinions in their own words, without being constrained by predefined options or categories. A qualitative open-ended question can help the interviewer explore the underlying reasons, motivations, or perceptions of the respondent. Option A is a qualitative open-ended question, because it asks the respondent to explain how call volume affects their job satisfaction and well-being, which may vary from person to person and require elaboration. Options B, C, and D are not qualitative open-ended questions, because they ask the respondent to choose between two alternatives (B and D) or provide a numerical value ? which are quantitative and closed-ended responses.

Questions 7

An analyst is working through data on comparing performance scores in different schools across the state, for ranking purposes. Since there is a lot of data and some extreme outliers, the analyst is trying to determine which type of statistical average would best represent the results. Which of the following is a concern when relying too heavily on summary statistics during data analysis?

A. Contextualization

B. Data variation

C. Data properties

D. Frequency

Buy Now

Correct Answer: A

Summary statistics are numerical measures that describe certain characteristics of a data set, such as the mean, median, mode, standard deviation, range, or quartiles. Summary statistics can help simplify and communicate complex data, but they can also obscure or distort important information, such as the distribution, shape, outliers, or trends of the data. Contextualization is the process of providing relevant background information, assumptions, limitations, or explanations for the data analysis and its results. Contextualization can help avoid misinterpretation, confusion, or bias when using summary statistics. Contextualization can also help connect the data analysis to the business problem, objectives, and stakeholders.

Questions 8

The results for a certification exam were revealed in percentage and percentile. How would you infer the results for an attendee at: 75%, 90th percentile?

A. While the attendee's exam score was 90/100. the attendee did better than 75% of the attendees

B. While the attendee's exam score was 90/100. the attendee did better than 25% of the attendees

C. While the attendee's exam score was 75/100. the attendee did better than 10% of the attendees

D. While the attendee's exam score was 75/100. the attendee did better than 90% of the attendees

Buy Now

Correct Answer: D

A percentage is a way of expressing a number as a fraction of 100, while a percentile is a way of expressing a number as a rank or position in a distribution of values. A percentage tells us how much of something there is, while a percentile

tells us how well something performed compared to others. To infer the results for an attendee at 75%, 90th percentile, we need to understand what these two numbers mean.

75% means that the attendee scored 75 out of 100 possible points on the exam. This is the absolute score of the attendee, which does not depend on how others performed.

90th percentile means that the attendee scored higher than 90% of all the attendees who took the exam. This is the relative score of the attendee, which depends on how others performed. For example, if there were 1000 attendees, the 90th

percentile would mean that the attendee scored higher than 900 attendees, and lower than 100 attendees.

Therefore, the correct inference is that while the attendee's exam score was 75/100, the attendee did better than 90% of the attendees. This means that the attendee's score was above average, and that the exam was relatively difficult or had

a low pass rate. References:

Difference Between Percentage and Percentile | Major DifferencesBYJU'S, BYJU'S, accessed on January 20, 2024.

Difference Between Percentage and Percentile (with Examples and Comparison Chart)Key Differences, Key Differences, accessed on January 20, 2024.

Certification in Business Data Analytics (IIBA瓹BDA), IIBA, accessed on January 20, 2024.

Questions 9

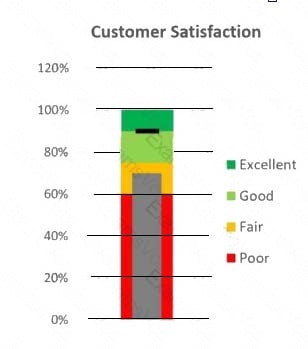
An analyst at an organization has just learnt about bullet charts. For the latest dashboard, the analyst has decided to display the customer satisfaction rate from the latest 2018 customer survey results through a bullet chart while comparing it to the 2017 customer satisfaction rate.What can be gleaned from this chart?
Customer Satisfaction

120%

100%

80%

A. The 2018 customer satisfaction rate is at 90%. between good and excellent, and exceeded its target of 70%

B. The 2018 customer satisfaction rate is at 90%. between good and excellent

C. The 2018 customer satisfaction rate was fair, at 70%, and did not reach its target of 90%

D. The 2018 customer satisfaction rate is at 90%. between good and excellent, while the 2017 customer satisfaction rate was at 70%

Buy Now

Correct Answer: D

A bullet chart is a type of bar chart that shows progress towards a goal or performance against a reference line1. It consists of a bar representing the featured measure, a reference line denoting a target or threshold, and a background with qualitative ranges (such as poor, fair, good, excellent)2. In this case, the featured measure is the customer satisfaction rate for 2018, the reference line is the target of 70%, and the background ranges are 0-50% (poor), 50-70% (fair), 70-90% (good), and 90-120% (excellent). The chart also shows a thin black bar representing the customer satisfaction rate for 2017, which can be used for comparison. From the chart, we can see that the 2018 customer satisfaction rate is at 90%, which falls in the excellent range and exceeds the target of 70%. We can also see that the 2017 customer satisfaction rate was at 70%, which falls in the good range and meets the target. Therefore, the correct answer is D, as it summarizes both the 2018 and 2017 customer satisfaction rates and their relation to the target and the ranges.

Questions 10

A movie production company wants to use analytics to decide which customers would choose to watch or not watch a particular movie after seeing a promotional teaser. The business analysis professional suggests they could make that prediction by identifying characteristics of the new movie and determining if the customer has watched other movies with similar characteristics.Thisis an example of using the following technique:

A. Logistic regression

B. Ouster analysis

C. Integer programming

D. Analysis of variance

Buy Now

Correct Answer: A

Logistic regression is a technique that can be used to model the probability of a binary outcome, such as choosing to watch or not watch a movie, based on one or more predictor variables, such as the characteristics of the movie and the customer's viewing history. Logistic regression can help the business analysis professional to identify the factors that influence the customer's decision and to estimate the likelihood of each customer's preference. Logistic regression can also be used to test hypotheses and to evaluate the performance of the predictive model.

Questions 11

The CustomerOrder entity will include information on all customer orders. Applying database normalization rules, which set of attributes will need to be normalized to avoid redundancies?

1.

Customerld

2.

CustomerPhone

3.

Orderld

4.

OrderDate

5.

ProductName

6.

ProductQuantity

7.

OrderTotal

A. CustomerPhone

B. ProductName

C. ProductName ProductQuantity

D. Orderld ProductName

E. Customerld OrderDate

Buy Now

Correct Answer: B

Database normalization is the process of organizing the data in a database to reduce redundancy and improve integrity, consistency, and performance1. Database normalization rules are based on the concept of normal forms, which are levels of database design that meet certain criteria2. One of the most common normal forms is the third normal form (3NF), which states that a table should not have any transitive dependencies, meaning that a non-key attribute should not depend on another non-key attribute3. In the CustomerOrder entity, the set of attributes that will need to be normalized to avoid redundancies are ProductName and ProductQuantity, as they are non-key attributes that depend on another non-key attribute, Orderld. This means that the same product information may be repeated for different orders, which could lead to data inconsistency, duplication, or update anomalies. To normalize this set of attributes, a separate table should be created for the OrderDetails entity, which would have Orderld, ProductName, and ProductQuantity as its attributes, and Orderld and ProductName as its composite primary key.

The other sets of attributes do not need to be normalized to avoid redundancies, as they do not violate the 3NF. CustomerPhone and ProductName are non-key attributes that depend on the primary key, Customerld and Orderld respectively, which is allowed by the 3NF. Orderld and ProductName are part of the composite primary key of the OrderDetails entity, which is also allowed by the 3NF. Customerld and OrderDate are both primary keys of the Customer and Order entities respectively, which are also allowed by the 3NF.

Questions 12

A 3rd party is marketing an application for financial institutions to use for credit scoring. This application is an example of what type of analytics?

A. Descriptive analytics

B. Prescriptive analytics

C. Exploratory

D. Inferential

Buy Now

Correct Answer: B

Prescriptive analytics is the type of analytics that provides recommendations or suggestions for optimal actions or decisions based on data analysis. Prescriptive analytics uses techniques such as optimization, simulation, and decision analysis to generate and evaluate various scenarios and outcomes. Prescriptive analytics can help financial institutions to use credit scoring to determine the best loan offers, interest rates, and repayment terms for their customers, as well as to manage risk and compliance. Prescriptive analytics is the most advanced and complex type of analytics, as it requires a high level of data quality, integration, and modeling, as well as human judgment and domain expertise.

Questions 13

An analytics team is discussing ways to improve company performance. Before identifying a set of research questions to analyze, they identify the need to understand the current company strategy and performance. The business analyst suggests using the Balanced Scorecard technique to guide this discussion. In which dimension of the matrix would the team be discussing metrics for changing and improving?

A. Learning and Growth

B. Customer

C. Financial

D. Internal Business Process

Buy Now

Correct Answer: A

According to the Introduction to Business Data Analytics: An Organizational View, the Balanced Scorecard technique is a strategic management tool that helps organizations align their vision, mission, and goals with their performance measures. The Balanced Scorecard consists of four dimensions: financial, customer, internal business process, and learning and growth. Each dimension has a set of objectives, measures, targets, and initiatives that reflect the organization's strategy and value proposition. The learning and growth dimension focuses on the metrics for changing and improving the organization'scapabilities, such as employee skills, knowledge, innovation, and culture. The learning and growth dimension supports the other three dimensions by providing the necessary resources and competencies to achieve the desired outcomes.

Exam Code: CBDA
Exam Name: Certification in Business Data Analytics (CBDA)
Last Update: Jul 02, 2026
Questions: 150

PDF (Q&A)

$45.99
ADD TO CART

VCE

$49.99
ADD TO CART

PDF + VCE

$59.99
ADD TO CART

Exam2Pass----The Most Reliable Exam Preparation Assistance

There are tens of thousands of certification exam dumps provided on the internet. And how to choose the most reliable one among them is the first problem one certification candidate should face. Exam2Pass provide a shot cut to pass the exam and get the certification. If you need help on any questions or any Exam2Pass exam PDF and VCE simulators, customer support team is ready to help at any time when required.

Home | Guarantee & Policy |  Privacy & Policy |  Terms & Conditions |  How to buy |  FAQs |  About Us |  Contact Us |  Demo |  Reviews

2026 Copyright @ exam2pass.com All trademarks are the property of their respective vendors. We are not associated with any of them.