
CLSSYB Online Practice Questions and Answers
A Belt working in a supply chain environment has to make a decision to change suppliers of critical raw materials for a new product upgrade. The purchasing manager is depending on the Belt's effort requiring that the average cost of an internal critical raw material component be less than or equal to $3,600 in order to stay within budget. Using a sample of 42 first article components, a Mean of the new product upgrade price of $3,200 and a Standard Deviation of $180 was estimated. Based on the data provided, the Z value for the data assuming a Normal Distribution is?
A. 1.11
B. 2.22
C. 4.30
D. 5.42
Sally and Sara sell flower pots at their garage sale. Martha motivates Rose mentioning that they will sell a minimum of 16 pots per day if the outside temperature exceeds 60?F. From a sample, whose population is assumed to follow a Normal Distribution, taken for 30 days at 60 degrees or more an average of 15.2 pots per day were sold with a Standard Deviation of 0.6 pots. What is the Z value for this sales process?
A. 0.67
B. 1.13
C. 1.33
D. 2.66
Which statement(s) are correct for the Regression Analysis shown here?
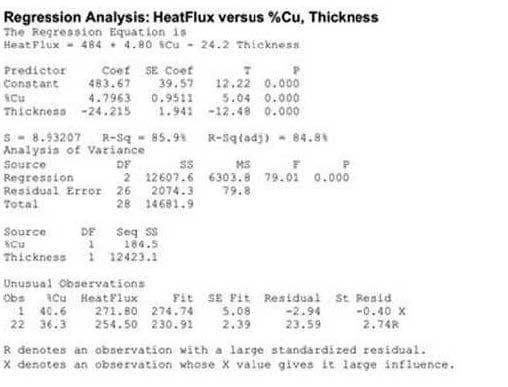
A. This Regression is an example of a Multiple Linear Regression.
B. This Regression is an example of Cubic Regression.
C. Thickness explains over 80% of the process variance in heat flux.
D. Both a and c
Which of the following are needed to calculate the process capability index, Cp?
A. The specification limits and the Mean
B. The specification limits and ^ (Sigma Cap)
C. The process Mean and ^ (Sigma Cap)
D. The upper and lower specification limits
Following have been exponents of Quality evolution except:
A. Juran
B. Philip Crossby
C. Wockhardt
D. Deming
Which of the following is NOT an advantage of using a median?
A. Extreme values do not affect the median as strongly as they affect Mean
B. A median can be calculated for qualitative descriptions
C. Median is easy to understand
D. Median can be calculated even for open-ended classes
Which of the following tools indicates a relationship between X and Y variables, and provides a visual correlation coefficient.
A. Cause (X) and Effect (Y) Diagram
B. Pareto Chart
C. Scatter Diagram
D. Control Chart
What percentage of data is included in +/- 1.5 Sigma?
A. 43.32 %
B. 86.64 %
C. 68.24 %
D. 0 %
One of the most popular measures of variability in a data set or population is _____.
A. Dispersion
B. Variation
C. Mean
D. Standard Deviation
An observation above upper Control limit is concluded as?
A. Process special cause variation
B. Process common cause variation
C. Process performance
D. No variation