E20-026 Online Practice Questions and Answers
What is an appropriate data visualization to use in a presentation for an analyst audience?
A. Pie chart
B. Area chart
C. Stacked bar chart
D. ROC curve
In R, functions like plot() and hist() are known as what?
A. generic functions
B. virtual methods
C. virtual functions
D. generic methods
When creating a project sponsor presentation, what is the main objective?
A. Show that you met the project goals
B. Show how you met the project goals
C. Show how well the model will meet the SLA (service level agreement)
D. Clearly describe the methods and techniques used
You are asked to write a report on how specific variables impact your client's sales using a data set
provided to you by the client. The data includes 15 variables that the client views as directly related to
sales, and you are restricted to these variables only.
After a preliminary analysis of the data, the following findings were made:
1.
Multicollinearity is not an issue among the variables
2.
Only three variables--A, B, and C--have significant correlation with sales You build a linear regression model on the dependent variable of sales with the independent variables of A, B, and C. The results of the regression are seen in the exhibit. You cannot request additional datA. what is a way that you could try to increase the R2 of the model without artificially inflating it?
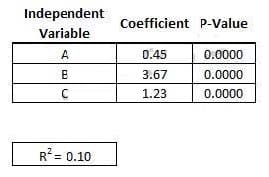
A. Create clusters based on the data and use them as model inputs
B. Force all 15 variables into the model as independent variables
C. Create interaction variables based only on variables A,B,and C
D. Break variables A,B,and C into their own univariate models
Which key role for a successful analytic project can consult and advise the project team on the value of end results and how these will be used on a day-to-day basis?
A. Business User
B. Project Manager
C. Data Scientist
D. Business Intelligence Analyst
In addition to less data movement and the ability to use larger datasets in calculations, what is a benefit of analytical calculations in a database?
A. quicker time to insight
B. more efficient handling of categorical values
C. improved connections between disparate data sources
D. full use of data aggregation functionality
What is required in a presentation for business analysts?
A. Budgetary considerations and requests
B. Operational process changes
C. Detailed statistical explanation of the applicable modeling theory
D. The presentation author's credentials
You are using k-means clustering to classify heart patients for a hospital. You have chosen Patient Sex, Height, Weight, Age and Income as measures and have used 3 clusters. When you create a pair-wise plot of the clusters, you notice that there is significant overlap between the clusters. What should you do?
A. Identify additional measures to add to the analysis
B. Remove one of the measures
C. Decrease the number of clusters
D. Increase the number of clusters
What is a property of window functions in SQL commands?
A. They can be used to calculate moving averages over various intervals.
B. They group rows into a single output row.
C. They can be used between the keywords FROM and WHERE in a SELECT command.
D. They don't require ordering of data within a window.
Refer to the exhibit. In the exhibit, the x-axis represents the derived probability of a borrower defaulting on a loan. Also in the exhibit, the pink represents borrowers that are known to have not defaulted on their loan, and the blue represents borrowers that are known to have defaulted on their loan. Which analytical method could produce the probabilities needed to build this exhibit?
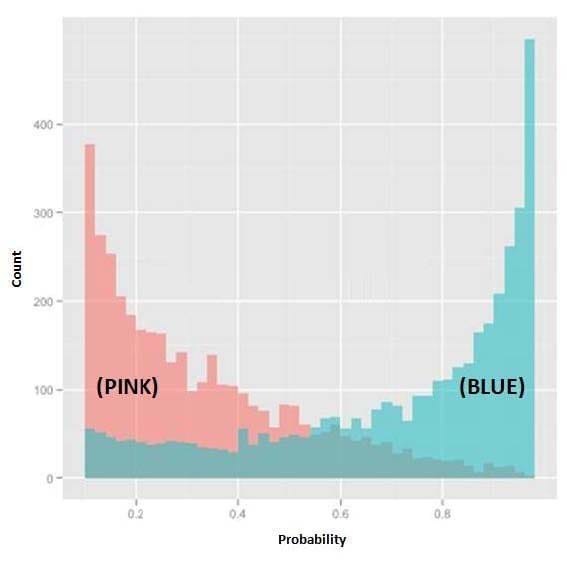
A. Logistic Regression
B. Linear Regression
C. Discriminant Analysis
D. Association Rules