LOOKER-BUSINESS-ANALYST Online Practice Questions and Answers
A global dashboard filter and the filter on a tile within that dashboard conflict because the global dashboard filter and the individual tile filter are based on the same field with different filter values.
What happens in this situation?
A. The filter values of both filters will combine in an additive manner and both filters will apply.
B. The individual tile's filter will override the global dashboard filter.
C. The global dashboard filter will override the individual tile filter.
D. The dashboard will break and warn the user that there are conflicting filter values.
An analyst has an Explore query that shows the sum of spend over time. The Explore query has the Sum of Spend measure pivoted by a Category of Spend dimension. The Category of Spend dimension has a value for Budgeted Spend and then categories for each type of unbudgeted spend.
Which visualization feature should the analyst use to separate budgeted spend visually from each category of unbudgeted spend?
A. Display row totals for each category.
B. Series type customization on budgeted spend.
C. Grouped series positioning on budgeted spend.
D. Transpose table to separate out budgeted spend.
An analyst needs to send a Look to an external client in CSV format. When the data is being downloaded, the Limit section has the option to select All Results grayed out, with text reading "All Results Unavailable."
What are three causes of this message? (Choose three.)
A. The Row Limit chosen in the Look is too high.
B. There is a table calculation in the Look.
C. Unlimited results are unsupported by CSV format.
D. The Row Totals option is turned on in the Look.
E. There is a Running Total measure in the Look.
F. The Totals option is turned on in the Look.
An analyst has created a line chart with Value Labels enabled, but the values are too long and need to be abbreviated.
Which visualization option should the analyst utilize to alter the display of the value labels?
A. Axis Value Labels
B. Value Format
C. Label Rotation
D. Time Label Format
A business analyst is using the Totals check box in an Explore to get the sum of a column of values. The number that appears in the Total row is much higher than the analyst expects, and this number is not the sum of the values in the column.
What is a possible cause of this discrepancy?
A. There is a row limit applied.
B. There is a filter on a dimension.
C. There is a problem with the underlying LookML.
D. There is a column limit applied.
A CEO wants to receive a daily email with the existing executive dashboard to review on a mobile device on the way to the office.
What should the analyst do to optimize the dashboard for mobile viewing?
A. Schedule the dashboard as HTML to adjust automatically.
B. Schedule the dashboard with the PDF format Use single column layout.
C. Create a mobile-friendly version of the dashboard by rearranging the tiles, and schedule the dashboard.
D. Schedule the dashboard with PDF paper size set to Fit Page to Dashboard.
Two weeks into the third quarter, an analyst needs to determine the total order count per month for only the first two quarters.
How should the analyst filter the query?
A. Created Month "is in the first 2 quarters"
B. Created Month "is in the past 2 complete quarters"
C. Created Month "is in the past 2 quarters"
D. Created Month "is in the last 6 months"
The query below shows how many uses purchased an item from each of two clothing departments.
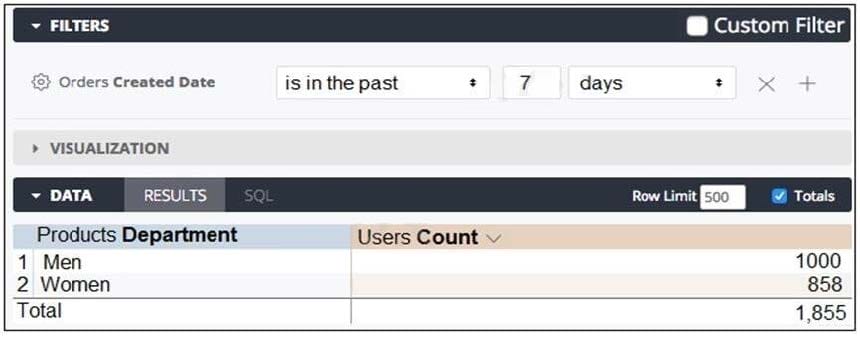
Why are the total and sum of the rows unequal?
A. There is a filter limiting the count in the Total row.
B. There is a faulty logic in the way users relate to clothing departments.
C. A user is only counted once in the total even if the user has purchased from both departments.
D. There are users who have never purchased a clothing item from either department.
An analyst has a dashboard with table visualizations that display the first few results, and the user can scroll down to see the remaining results. The analyst wants to download a PDF of the dashboard.
How should the analyst ensure that the PDF shows all available results in the UI dashboard?
A. Select the Expand Tables option.
B. Select the All Results option
C. Select the Allow Scroll option and specify each table.
D. Select the Paper Size option and specify a large size.
An analyst creates a dashboard that shows sales at an aggregate and then an individual level. This dashboard is slow to run, and the analyst sees a warning about how load times may be impacted in dashboards with more than 25 tiles.
What should the analyst create to make sure all data sources in this dashboard are connected but still load quickly?
A. Dashboard filter to specify which individual data shows
B. Two dashboards, one with aggregate and one with individual data
C. Two dashboards with a text tile to hyperlink from one dashboard to the other
D. Folder with all dashboard tiles for aggregate data and individual data.