PL-300 Online Practice Questions and Answers
You build a report to help the sales team understand its performance and the drivers of sales. The team needs to have a single visualization to identify which factors affect success. Which type of visualization should you use?
A. Key influences
B. Funnel chart
C. QandA
D. Line and clustered column chart
You have a line chart that shows the number of employees in a department over time. You need to see the total salary costs of the employees when you hover over a data point. What is possible way to achieve this goal?
A. Add a salary to the tooltips.
B. Add a salary to the visual filters.
C. Add salary to the drillthrough fields.
Note: This question is part of a series of questions that present the same scenario. Each question in the series contains a unique solution that might meet the stated goals. Some question sets might have more than one correct solution, while
others might not have a correct solution.
After you answer a question in this section, you will NOT be able to return to it. As a result, these questions will not appear in the review screen.
You create a parameter named DataSourceExcel that holds the file name and location of a Microsoft Excel data source.
You need to update the query to reference the parameter instead of multiple hard-coded copies of the location within each query definition.
Solution: You create a new query that references DataSourceExcel.
Does this meet the goal?
A. Yes
B. No
You are configuring a Microsoft Power Bl data model to enable users to ask natural language questions by using QandA. You have a table named Customer that has the following measure.
Customer Count = DISTINCTCOUNT(Customer[CustomerID])
Users frequently refer to customers as subscribers.
You need to ensure that the users can get a useful result for "subscriber count" by using QandA. The solution must minimize the size of the model.
What should you do?
A. Add a description of "subscriber count" to the Customer Count measure.
B. Set Summarize By to None for the CustomerlD column.
C. Add a description of "Subscriber" to the Customer table.
D. Add a synonym of "subscriber" to the Customer table.
You have an app workspace that contains a dashboard and four reports. All the reports are generated from a single dataset that contains sales data for your company. The reports display the data configured as shown in the following table.

You need to ensure that the users of the reports can locate the correct report by using natural language queries. What should you do?
A. From the properties of the dataset, create four Featured QandA Questions.
B. From the Format settings of the reports, modify the Page Information.
C. From the properties of the dataset, modify the QandA and Cortana settings.
D. From the properties of the workspace, modify the Language Settings.
You need to create a Power Bl theme that will be used in multiple reports. The theme will include corporate branding for font size, color, and bar chart formatting. What should you do?
A. Create a theme as a PBIVIZ file and import the theme into Power Bl Desktop.
B. Create a theme as a JSON file and import the theme into Power Bl Desktop.
C. From Power Bl Desktop, use a built-in report theme.
D. From Power Bl Desktop, customize the current theme.
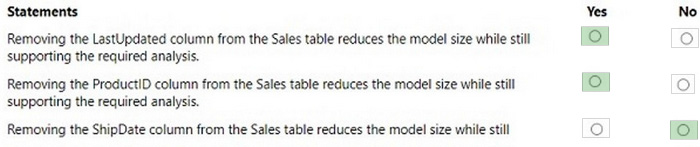
HOTSPOT
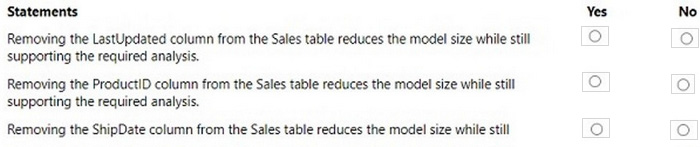
The data model must support the following analysis:
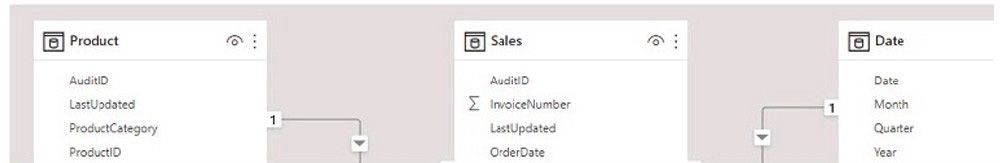
Total sales by product by month in which the order was placed Quantities sold by product by day on which the order was placed Number Of sales transactions by quarter in Which the order was placed For each Of the following statements, select Yes if the statement is true. Otherwise, select NO.
Hot Area:
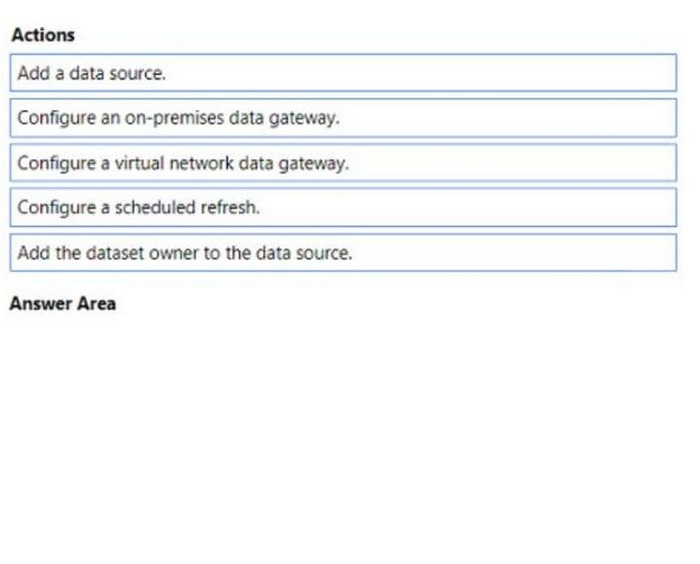
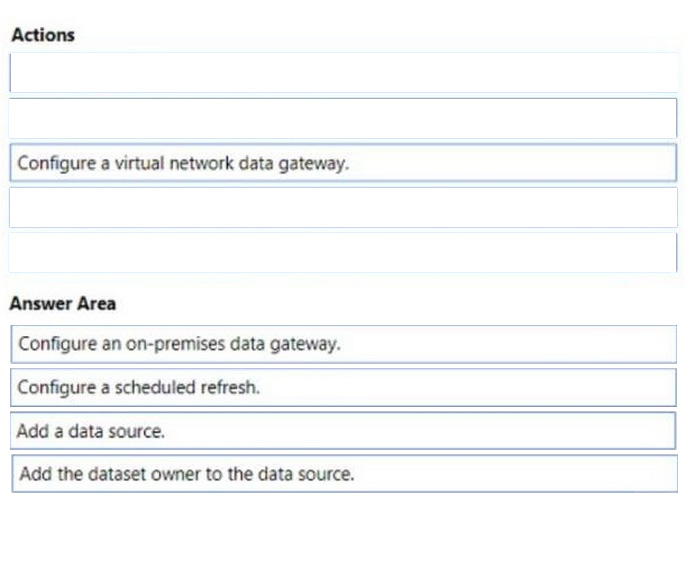
DRAG DROP
You publish a dataset lhat contains data from an on-premises Microsoft SQL Server database.
The dataset must be refreshed daily.
You need to ensure that the Power BI service can connect to the database and refresh the dataset.
Which four actions should you perform in sequence?
To answer, move the appropriate actions from the list of actions to the answer area and arrange them in the correct
Select and Place:
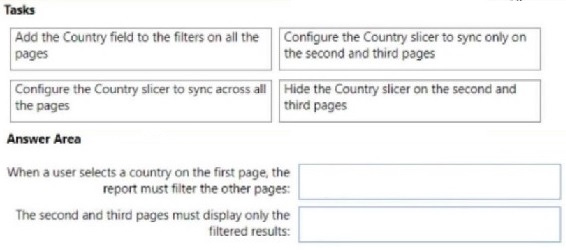
DRAG DROP
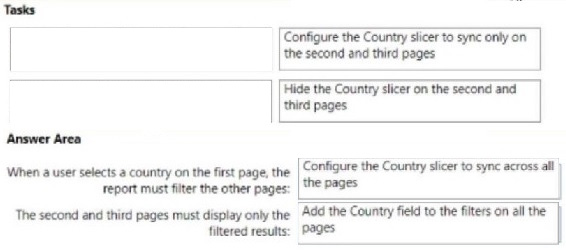
You have a Power Bl report that contains three pages. The pages are used to analyze sales across various countries.
You add a sheer named Country to each page of the report.
You need to configure the report to meet the following requirements:
1.
When a user selects a country on the first page, the report must filter the other pages.
2.
The second and third pages must display only the filtered results.
Which task should you perform for each requirement? To answer, drag the appropriate task to the correct requirement. Each task may be used once, more than once, or not at all. You may need to drag the split bar between panes or scroll to
view content.
NOTE Each correct selection is worth one point.
Select and Place:
DRAG DROP
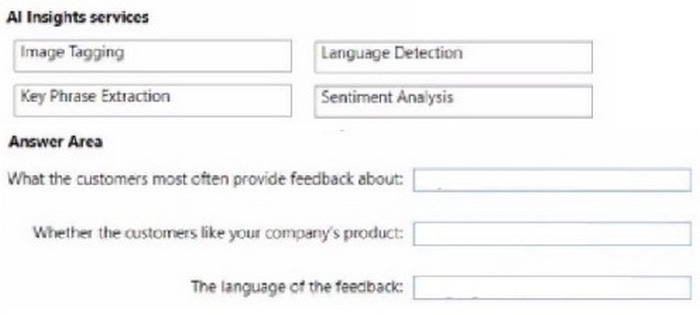
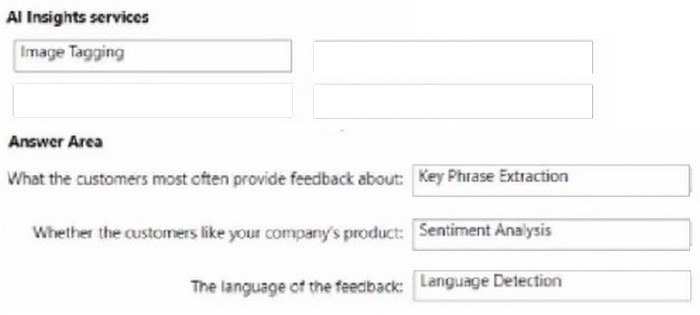
You use Power Query Editor to preview customer feedback data.
You need to use Al Insights to add a column of enhanced data based on the customer feedback. The solution must identify the following:
1.
What the customers most often provide feedback about
2.
Whether the customers like your company's product
3.
The language of the feedback
Which Al Insights service should you use for each output? To answer, drag the appropriate services to the correct outputs. Each service may be used once, more than once. or not at all. You may need to drag the split bar between panes or
scroll to view content.
NOTE: Each correct selection is worth one point.
Select and Place: