
Exam2pass
0 items Sign In or Register
  • Home
  • IT Exams
  • Guarantee
  • FAQs
  • Reviews
  • Contact Us
  • Demo
Exam2pass > Splunk > Splunk Certifications > SPLK-4001 > SPLK-4001 Online Practice Questions and Answers

SPLK-4001 Online Practice Questions and Answers

Questions 4

Clicking a metric name from the results in metric finder displays the metric in Chart Builder. What action needs to be taken in order to save the chart created in the UI?

A. Create a new dashboard and save the chart.

B. Save the chart to multiple dashboards.

C. Make sure that data is coming in for the metric then save the chart.

D. Save the chart to a dashboard.

Buy Now

Correct Answer: D

According to the web search results, clicking a metric name from the results in metric finder displays the metric in Chart Builder1. Chart Builder is a tool that allows you to create and customize charts using metrics, dimensions, and analytics

functions2. To save the chart created in the UI, you need to do the following steps:

Click the Save button on the top right corner of the Chart Builder. This will open a dialog box where you can enter the chart name and description, and choose the dashboard where you want to save the chart.

Enter a name and a description for your chart. The name should be descriptive and unique, and the description should explain the purpose and meaning of the chart.

Choose an existing dashboard from the drop-down menu, or create a new dashboard by clicking the + icon. A dashboard is a collection of charts that display metrics and events for your services or hosts. You can organize and share

dashboards with other users in your organization using dashboard groups. Click Save. This will save your chart to the selected dashboard and redirect you to the dashboard view. You can also access your saved chart from the Dashboards

menu on the left navigation bar.

Questions 5

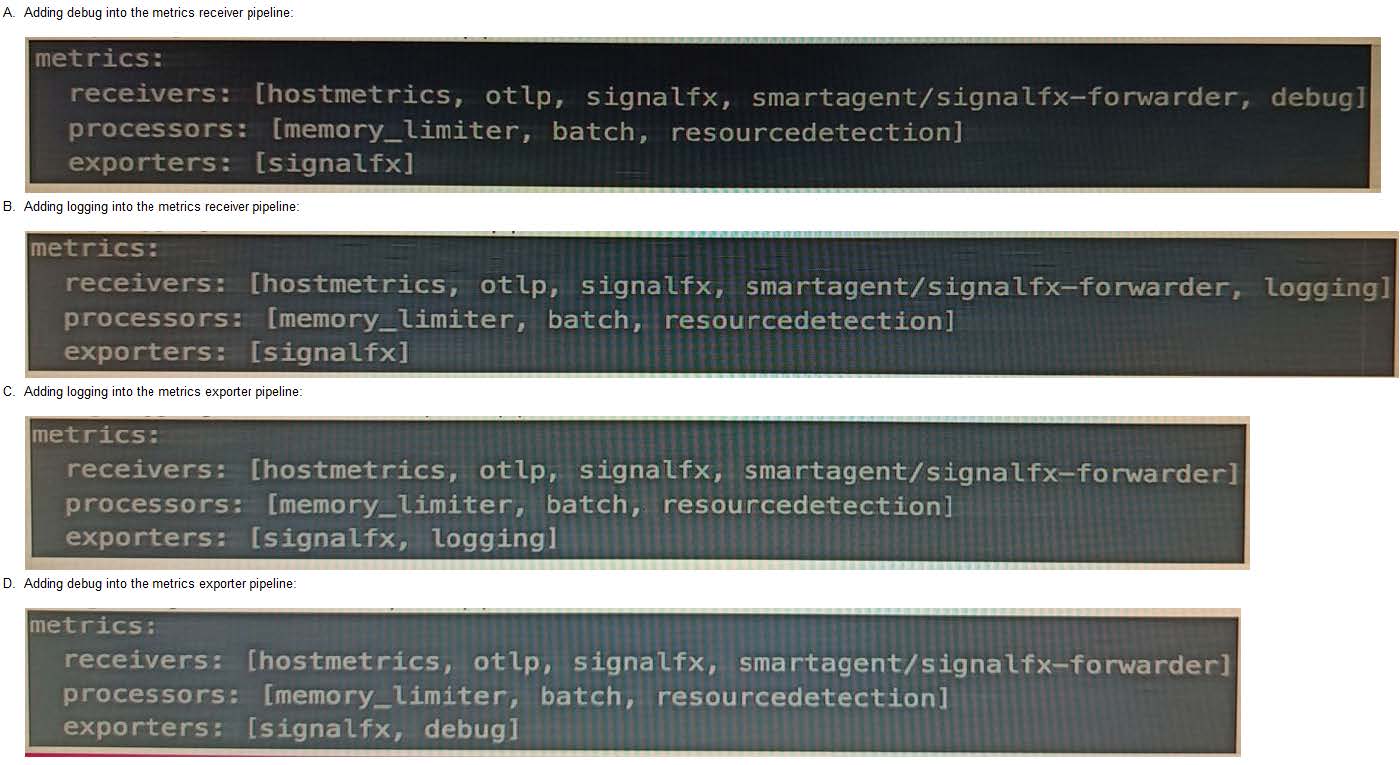
A customer is experiencing issues getting metrics from a new receiver they have configured in the OpenTelemetry Collector. How would the customer go about troubleshooting further with the logging exporter?
A. Option A

B. Option B

C. Option C

D. Option D

Buy Now

Correct Answer: B

The correct answer is B. Adding logging into the metrics receiver pipeline. The logging exporter is a component that allows the OpenTelemetry Collector to send traces, metrics, and logs directly to the console. It can be used to diagnose and troubleshoot issues with telemetry received and processed by the Collector, or to obtain samples for other purposes To activate the logging exporter, you need to add it to the pipeline that you want to diagnose. In this case, since you are experiencing issues with a new receiver for metrics, you need to add the logging exporter to the metrics receiver pipeline. This will create a new plot that shows the metrics received by the Collector and any errors or warnings that might occur The image that you have sent with your question shows how to add the logging exporter to the metrics receiver pipeline. You can see that the exporters section of the metrics pipeline includes logging as one of the options. This means that the metrics received by any of the receivers listed in the receivers section will be sent to the logging exporter as well as to any other exporters listed To learn more about how to use the logging exporter in Splunk Observability Cloud, you can refer to this documentation. https://docs.splunk.com/Observability/gdi/opentelemetry/components/logging- exporter.html https://docs.splunk.com/Observability/gdi/opentelemetry/exposed- endpoints.html

Questions 6

A user wants to add a link to an existing dashboard from an alert. When they click the dimension value in the alert message, they are taken to the dashboard keeping the context. How can this be accomplished? (select all that apply)

A. Build a global data link.

B. Add a link to the Runbook URL.

C. Add a link to the field.

D. Add the link to the alert message body.

Buy Now

Correct Answer: AC

The possible ways to add a link to an existing dashboard from an alert are: Build a global data link. A global data link is a feature that allows you to create a link from any dimension value in any chart or table to a dashboard of your choice. You can specify the source and target dashboards, the dimension name and value, and the query parameters to pass along. When you click on the dimension value in the alert message, you will be taken to the dashboard with the context preserved Add a link to the field. A field link is a feature that allows you to create a link from any field value in any search result or alert message to a dashboard of your choice. You can specify the field name and value, the dashboard name and ID, and the query parameters to pass along. When you click on the field value in the alert message, you will be taken to the dashboard with the context preserved Therefore, the correct answer is A and C. To learn more about how to use global data links and field links in Splunk Observability Cloud, you can refer to these documentations. https://docs.splunk.com/Observability/gdi/metrics/charts.html#Global-data-links https://docs.splunk.com/Observability/gdi/metrics/search.html#Field-links

Questions 7

Which of the following are accurate reasons to clone a detector? (select all that apply)

A. To modify the rules without affecting the existing detector.

B. To reduce the amount of billed TAPM for the detector.

C. To add an additional recipient to the detector's alerts.

D. To explore how a detector was created without risk of changing it.

Buy Now

Correct Answer: AD

The correct answers are A and D.

According to the Splunk Test Blueprint - O11y Cloud Metrics User document, one of the alerting concepts that is covered in the exam is detectors and alerts. Detectors are the objects that define the conditions for generating alerts, and alerts

are the notifications that are sent when those conditions are met.

The Splunk O11y Cloud Certified Metrics User Track document states that one of the recommended courses for preparing for the exam is Alerting with Detectors, which covers how to create, modify, and manage detectors and alerts. In the

Alerting with Detectors course, there is a section on Cloning Detectors, which explains that cloning a detector creates a copy of the detector with all its settings, rules, and alert recipients. The document also provides some reasons why you

might want to clone a detector, such as:

To modify the rules without affecting the existing detector. This can be useful if you want to test different thresholds or conditions before applying them to the original detector.

To explore how a detector was created without risk of changing it. This can be helpful if you want to learn from an existing detector or use it as a template for creating a new one.

Therefore, based on these documents, we can conclude that A and D are accurate reasons to clone a detector. B and C are not valid reasons because:

Cloning a detector does not reduce the amount of billed TAPM for the detector. TAPM stands for Tracked Active Problem Metric, which is a metric that has been alerted on by a detector. Cloning a detector does not change the number of

TAPM that are generated by the original detector or the clone. Cloning a detector does not add an additional recipient to the detector's alerts. Cloning a detector copies the alert recipients from the original detector, but it does not add any new

ones. To add an additional recipient to a detector's alerts, you need to edit the alert settings of the detector.

Questions 8

An SRE creates a new detector to receive an alert when server latency is higher than 260 milliseconds. Latency below 260 milliseconds is healthy for their service. The SRE creates a New Detector with a Custom Metrics Alert Rule for latency and sets a Static Threshold alert condition at 260ms.

How can the number of alerts be reduced?

A. Adjust the threshold.

B. Adjust the Trigger sensitivity. Duration set to 1 minute.

C. Adjust the notification sensitivity. Duration set to 1 minute.

D. Choose another signal.

Buy Now

Correct Answer: B

According to the Splunk O11y Cloud Certified Metrics User Track document1, trigger sensitivity is a setting that determines how long a signal must remain above or below a threshold before an alert is triggered. By default, trigger sensitivity is set to Immediate, which means that an alert is triggered as soon as the signal crosses the threshold. This can result in a lot of alerts, especially if the signal fluctuates frequently around the threshold value. To reduce the number of alerts, you can adjust the trigger sensitivity to a longer duration, such as 1 minute, 5 minutes, or 15 minutes. This means that an alert is only triggered if the signal stays above or below the threshold for the specified duration. This can help filter out noise and focus on more persistent issues.

Questions 9

A customer is sending data from a machine that is over-utilized. Because of a lack of system resources, datapoints from this machine are often delayed by up to 10 minutes. Which setting can be modified in a detector to prevent alerts from firing before the datapoints arrive?

A. Max Delay

B. Duration

C. Latency

D. Extrapolation Policy

Buy Now

Correct Answer: A

The correct answer is A. Max Delay. Max Delay is a parameter that specifies the maximum amount of time that the analytics engine can wait for data to arrive for a specific detector. For example, if Max Delay is set to 10 minutes, the detector will wait for only a maximum of 10 minutes even if some data points have not arrived. By default, Max Delay is set to Auto, allowing the analytics engine to determine the appropriate amount of time to wait for data points1 In this case, since the customer knows that the data from the over-utilized machine can be delayed by up to 10 minutes, they can modify the Max Delay setting for the detector to 10 minutes. This will prevent the detector from firing alerts before the data points

arrive, and avoid false positives or missing data

To learn more about how to use Max Delay in Splunk Observability Cloud, you can refer to this documentation.

1: https://docs.splunk.com/observability/alerts-detectors-notifications/detector- options.html#Max-Delay

Questions 10

Changes to which type of metadata result in a new metric time series?

A. Dimensions

B. Properties

C. Sources

D. Tags

Buy Now

Correct Answer: A

The correct answer is A. Dimensions. Dimensions are metadata in the form of key-value pairs that are sent along with the metrics at the time of ingest. They provide additional information about the metric, such as the name of the host that sent the metric, or the location of the server. Along with the metric name, they uniquely identify a metric time series (MTS)1 Changes to dimensions result in a new MTS, because they create a different combination of metric name and dimensions. For example, if you change the hostname dimension from host1 to host, you will create a new MTS for the same metric name1 Properties, sources, and tags are other types of metadata that can be applied to existing MTSes after ingest. They do not contribute to uniquely identify an MTS, and they do not create a new MTS when changed To learn more about how to use metadata in Splunk Observability Cloud, you can refer to this documentation. https://docs.splunk.com/Observability/metrics-and-metadata/metrics.html#Dimensions https://docs.splunk.com/Observability/metrics-and-metadata/metrics-dimensions-mts.html

Questions 11

A customer has a large population of servers. They want to identify the servers where utilization has increased the most since last week. Which analytics function is needed to achieve this?

A. Rate

B. Sum transformation

C. Tlmeshift

D. Standard deviation

Buy Now

Correct Answer: C

The correct answer is C. Timeshift.

According to the Splunk Observability Cloud documentation1, timeshift is an analytic function that allows you to compare the current value of a metric with its value at a previous time interval, such as an hour ago or a week ago. You can use

the timeshift function to measure the change in a metric over time and identify trends, anomalies, or patterns. For example, to identify the servers where utilization has increased the most since last week, you can use the following SignalFlow

code:

timeshift(1w, counters("server.utilization"))

This will return the value of the server.utilization counter metric for each server one week ago. You can then subtract this value from the current value of the same metric to get the difference in utilization. You can also use a chart to visualize

the results and sort them by the highest difference in utilization.

Questions 12

What are the best practices for creating detectors? (select all that apply)

A. View data at highest resolution.

B. Have a consistent value.

C. View detector in a chart.

D. Have a consistent type of measurement.

Buy Now

Correct Answer: ABCD

The best practices for creating detectors are: View data at highest resolution. This helps to avoid missing important signals or patterns in the data that could indicate anomalies or issues Have a consistent value. This means that the metric or dimension used for detection should have a clear and stable meaning across different sources, contexts, and time periods. For example, avoid using metrics that are affected by changes in configuration, sampling, or aggregation View detector in a chart. This helps to visualize the data and the detector logic, as well as to identify any false positives or negatives. It also allows to adjust the detector parameters and thresholds based on the data distribution and behavior Have a consistent type of measurement. This means that the metric or dimension used for detection should have the same unit and scale across different sources, contexts, and time periods. For example, avoid mixing bytes and bits, or seconds and milliseconds. https://docs.splunk.com/Observability/gdi/metrics/detectors.html#Best-practices-for- detectors https://docs.splunk.com/Observability/gdi/metrics/detectors.html#Best- practices-for-detectors https://docs.splunk.com/Observability/gdi/metrics/detectors.html#View-detector-in-a-chart : https://docs.splunk.com/Observability/gdi/metrics/detectors.html#Best-practices-for- detectors

Questions 13

A customer deals with a holiday rush of traffic during November each year, but does not want to be flooded with alerts when this happens. The increase in traffic is expected and consistent each year. Which detector condition should be used when creating a detector for this data?

A. Outlier Detection

B. Static Threshold

C. Calendar Window

D. Historical Anomaly

Buy Now

Correct Answer: D

historical anomaly is a detector condition that allows you to trigger an alert when a signal deviates from its historical pattern. Historical anomaly uses machine learning to learn the normal behavior of a signal based on its past data, and then compares the current value of the signal with the expected value based on the learned pattern. You can use historical anomaly to detect unusual changes in a signal that are not explained by seasonality, trends, or cycles. Historical anomaly is suitable for creating a detector for the customer's data, because it can account for the expected and consistent increase in traffic during November each year. Historical anomaly can learn that the traffic pattern has a seasonal component that peaks in November, and then adjust the expected value of the traffic accordingly. This way, historical anomaly can avoid triggering alerts when the traffic increases in November, as this is not an anomaly, but rather a normal variation. However, historical anomaly can still trigger alerts when the traffic deviates from the historical pattern in other ways, such as if it drops significantly or spikes unexpectedly.

Exam Code: SPLK-4001
Exam Name: Splunk O11y Cloud Certified Metrics User
Last Update: Jul 02, 2026
Questions: 54

PDF (Q&A)

$45.99
ADD TO CART

VCE

$49.99
ADD TO CART

PDF + VCE

$59.99
ADD TO CART

Exam2Pass----The Most Reliable Exam Preparation Assistance

There are tens of thousands of certification exam dumps provided on the internet. And how to choose the most reliable one among them is the first problem one certification candidate should face. Exam2Pass provide a shot cut to pass the exam and get the certification. If you need help on any questions or any Exam2Pass exam PDF and VCE simulators, customer support team is ready to help at any time when required.

Home | Guarantee & Policy |  Privacy & Policy |  Terms & Conditions |  How to buy |  FAQs |  About Us |  Contact Us |  Demo |  Reviews

2026 Copyright @ exam2pass.com All trademarks are the property of their respective vendors. We are not associated with any of them.