TDA-C01 Online Practice Questions and Answers
A colleague provides you with access to a folder that contains the following files:
Sates.csv Bookl.twb Sates.hyper Export.mdb
Which He contains an extract?
A. Export mdb
B. Book1.twb
C. Sales.hyper
D. Sales.csv
In which throe formats can you export a worksheet from the Worksheet menu? Choose three
A. .png
B. .html
C. .xlsx
D. .txt
E. .pptx
F. .csv
You create a parameter named Choose Region fiat contains values from a field named Region.
You want users to be able to use the Choose Region parameter to interact with a chart by logging between different regions
What should you do next?
A. Add Region to me Fitters card
B. Add the [Region] = [choose Region) formula to the Filters card
C. Add the Choose Region parameter to the Pages card
D. Set the Choose Region parameter to Single Value (list)
You have the following primary data source that contains a dimension named Dorm_Code.
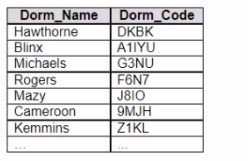
You receive the following secondary data source that contains updated dorm codes.
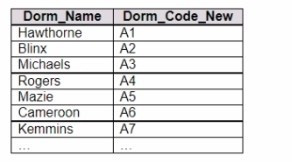
You need to bring the updated dorm codes into Tableau and use the codes in existing visualizations. The new dorm codes must use the existing field name of Dorm_Code.
What should you do?
A. Bring in the secondary data source as a union.
B. Bring in the secondary table as a left join to the primary data source. From the Data Source page, select Create Calculated Field in the Dorm_Name field and enter [Dcrm_Name_New] in the calculation window
C. Bring in the secondary data source by using relationships. From the Data pane, right- click Dorm_Name select Replace References, and then select Dorm_Name_New
D. Create a data blend and select Edit Primary Aliases to replace the primary data source alias values with values from the secondary data source
You have the following:
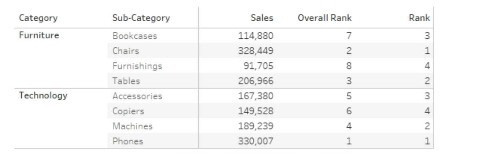
Overall Rank and Rank are calculated fields that use the RANK function.
You filter out the sub-category where [Ovorall Rank] - 1.
For which three the sub-categories will the value of Rank change? Choose three.
A. Furnishings
B. Tables
C. Chairs
D. Accessories
E. Copiers
F. Machines
G. Phones
H. Bookcases
You have a workbook that connects to a database. The database requires authentication.
You plan to publish the workbook and schedule a daily refresh of the data.
Which two conditions must be met to schedule the refresh? Choose two.
A. The credentials must be embedded.
B. The data source must be stored as a hyper file.
C. The data source must use a live connection.
D. The data must be extracted.
In a dataset, you have a string field named Name that contains unnecessary semicolons.
Which function should you use to remove the semicolons from the Name field?
A. TRIM
B. CONTAINS
C. REPLACE
D. SPLIT
CORRECT TEXT
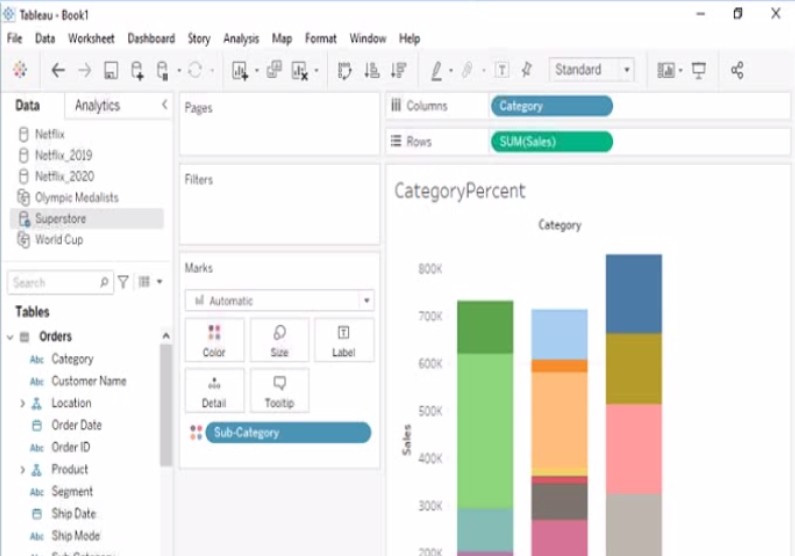
Open the link to Book1 found on the desktop. Open the CategoryPercentage worksheet.
Modify the bar chart show the percentage of sales for each Subcategory within every Category. The total percentage for every Category must be 100%.
A. Check the steps below in explanation.
CORRECT TEXT
Open the link to Book1 found on the desktop. Open the Histogram worksheet and use the Superstone data source.
Create a histogram on the Quantity field by using bin size of 3.
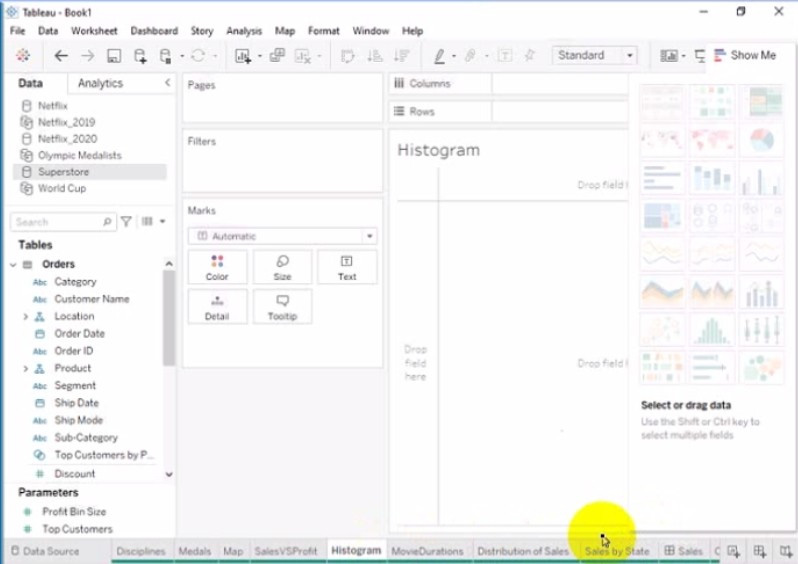
A. Check the steps below in explanation.
CORRECT TEXT
Open the link to Book1 found on the desktop. Open Disciplines worksheet.
Filter the table to show the members of the Top10 set and the members of the Bottom10 set. There should be a total of 20 rows.
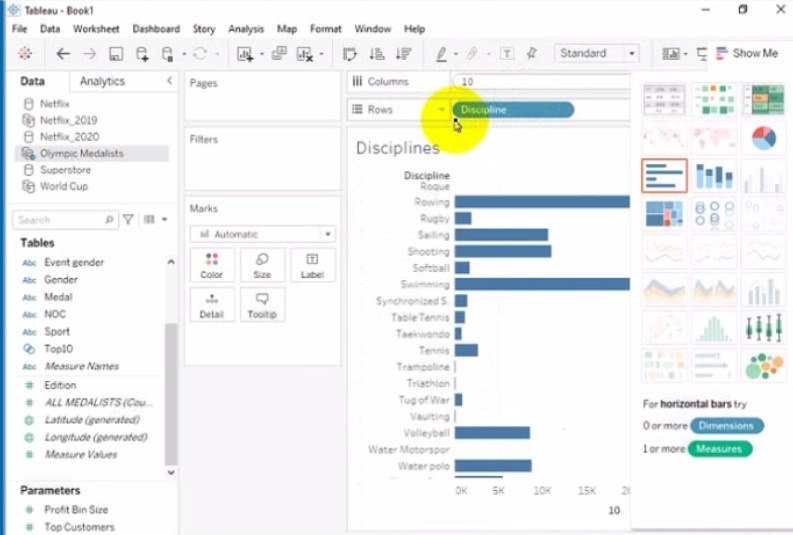
A. Check the steps below in explanation.