NCM-MCI-6.5 Online Practice Questions and Answers
CORRECT TEXT
Task 16
Running NCC on a cluster prior to an upgrade results in the following output
FAIL: CVM System Partition /home usage at 93% (greater than threshold, 90%) Identify the CVM with the issue, remove the fil causing the storage bloat, and check the health again by running the individual disk usage health check only on the problematic CVM do not run NCC health check
Note: Make sure only the individual health check is executed from the affected node
A. Answer: See the for step by step solution.
CORRECT TEXT
Task 13
The application team is reporting performance degradation for a business-critical application that runs processes all day on Saturdays.
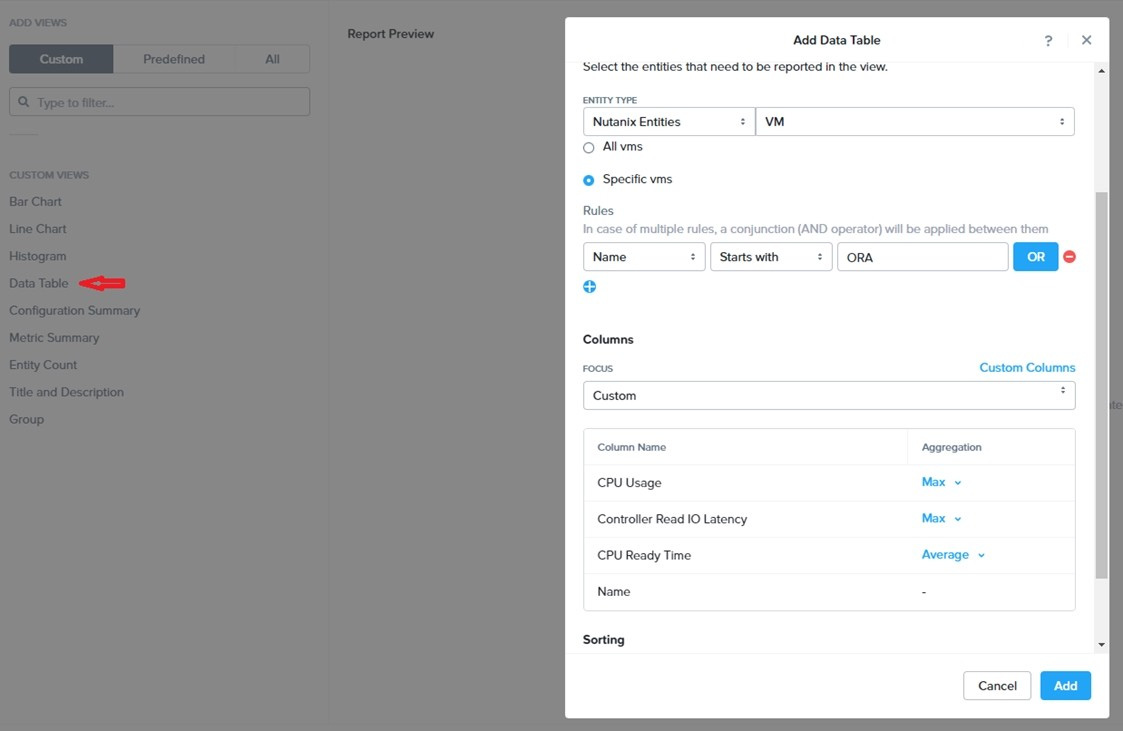
The team is requesting monitoring or processor, memory and storage utilization for the three VMs that make up the database cluster for the application: ORA01, ORA02 and ORA03.
The report should contain tables for the following:
At the cluster level, only for the current cluster:
The maximum percentage of CPU used
At the VM level, including any future VM with the prefix ORA:
The maximum time taken to process I/O Read requests
The Maximum percentage of time a VM waits to use physical CPU, out of the local CPU time allotted to the VM.
The report should run on Sundays at 12:00 AM for the previous 24 hours. The report should be emailed toappdev@cyberdyne.netwhen competed.
Create a report named Weekends that meets these requirements
Note: You must name the report Weekends to receive any credit. Any other objects needed can be named as you see fit. SMTP is not configured.
A. Answer: See the for step by step solution.
CORRECT TEXT
Task 11
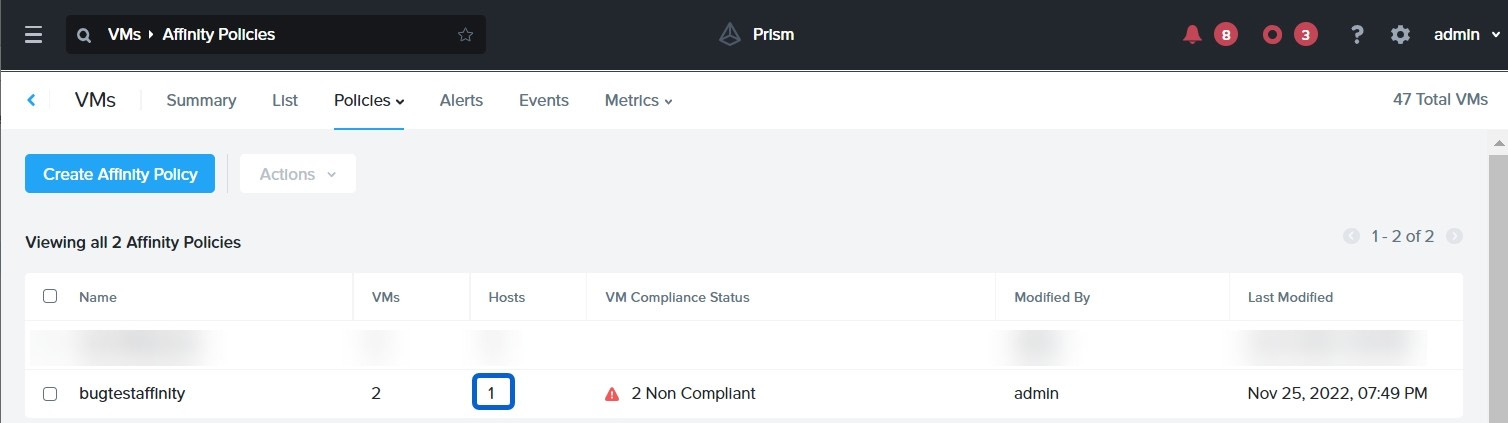
An administrator has noticed that after a host failure, the SQL03 VM was not powered back on from another host within the cluster. The Other SQL VMs (SQL01, SQL02) have recovered properly in the past.
Resolve the issue and configure the environment to ensure any single host failure affects a minimal number os SQL VMs.
Note: Do not power on any VMs
A. Answer: See the for step by step solution.
CORRECT TEXT
Task4
An administrator will be deploying Flow Networking and needs to validate that the environment, specifically switch vs1, is appropriately configured. Only VPC traffic should be carried by the switch.
Four versions each of two possible commands have been placed in Desktop\Files\Network\flow.txt. Remove the hash mark (#) from the front of correct First command and correct Second command and save the file.
Only one hash mark should be removed from each section. Do not delete or copy lines, do not add additional lines. Any changes other than removing two hash marks (#) will result in no credit.
Also, SSH directly to any AHV node (not a CVM) in the cluster and from the command line display an overview of the Open vSwitch configuration. Copy and paste this to a new text file named Desktop\Files\Network\AHVswitch.txt.
Note: You will not be able to use the 192.168.5.0 network in this environment.
First command
#net.update_vpc_traffic_config virtual_switch=vs0
net.update_vpc_traffic_config virtual_switch=vs1
#net.update_vpc_east_west_traffic_config virtual_switch=vs0
#net.update_vpc_east_west_traffic_config virtual_switch=vs1
Second command
#net.update_vpc_east_west_traffic_config permit_all_traffic=true
net.update_vpc_east_west_traffic_config permit_vpc_traffic=true
#net.update_vpc_east_west_traffic_config permit_all_traffic=false
#net.update_vpc_east_west_traffic_config permit_vpc_traffic=false
A. Answer: See the for step by step solution.
CORRECT TEXT Task 3 An administrator needs to assess performance gains provided by AHV Turbo at the guest level. To perform the test the administrator created a Windows 10 VM named Turbo with the following configuration. 1 vCPU 8 GB RAM SATA Controller
40 GB vDisk
The stress test application is multi-threaded capable, but the performance is not as expected with AHV Turbo enabled. Configure the VM to better leverage AHV Turbo.
Note: Do not power on the VM. Configure or prepare the VM for configuration as best you can without powering it on.
A. Answer: See the for step by step solution.
CORRECT TEXT Task 14 The application team has requested several mission-critical VMs to be configured for disaster recovery. The remote site (when added) will not be managed by Prism Central. As such, this solution should be built using the Web Console.
Disaster Recovery requirements per VM: Mkt01 RPO: 2 hours Retention: 5 snapshots Fin01 RPO: 15 minutes Retention: 7 days Dev01 RPO: 1 day Retention: 2 snapshots Configure a DR solution that meets the stated requirements. Any objects created in this item must start with the name of the VM being protected. Note: the remote site will be added later
A. Answer: See the for step by step solution.


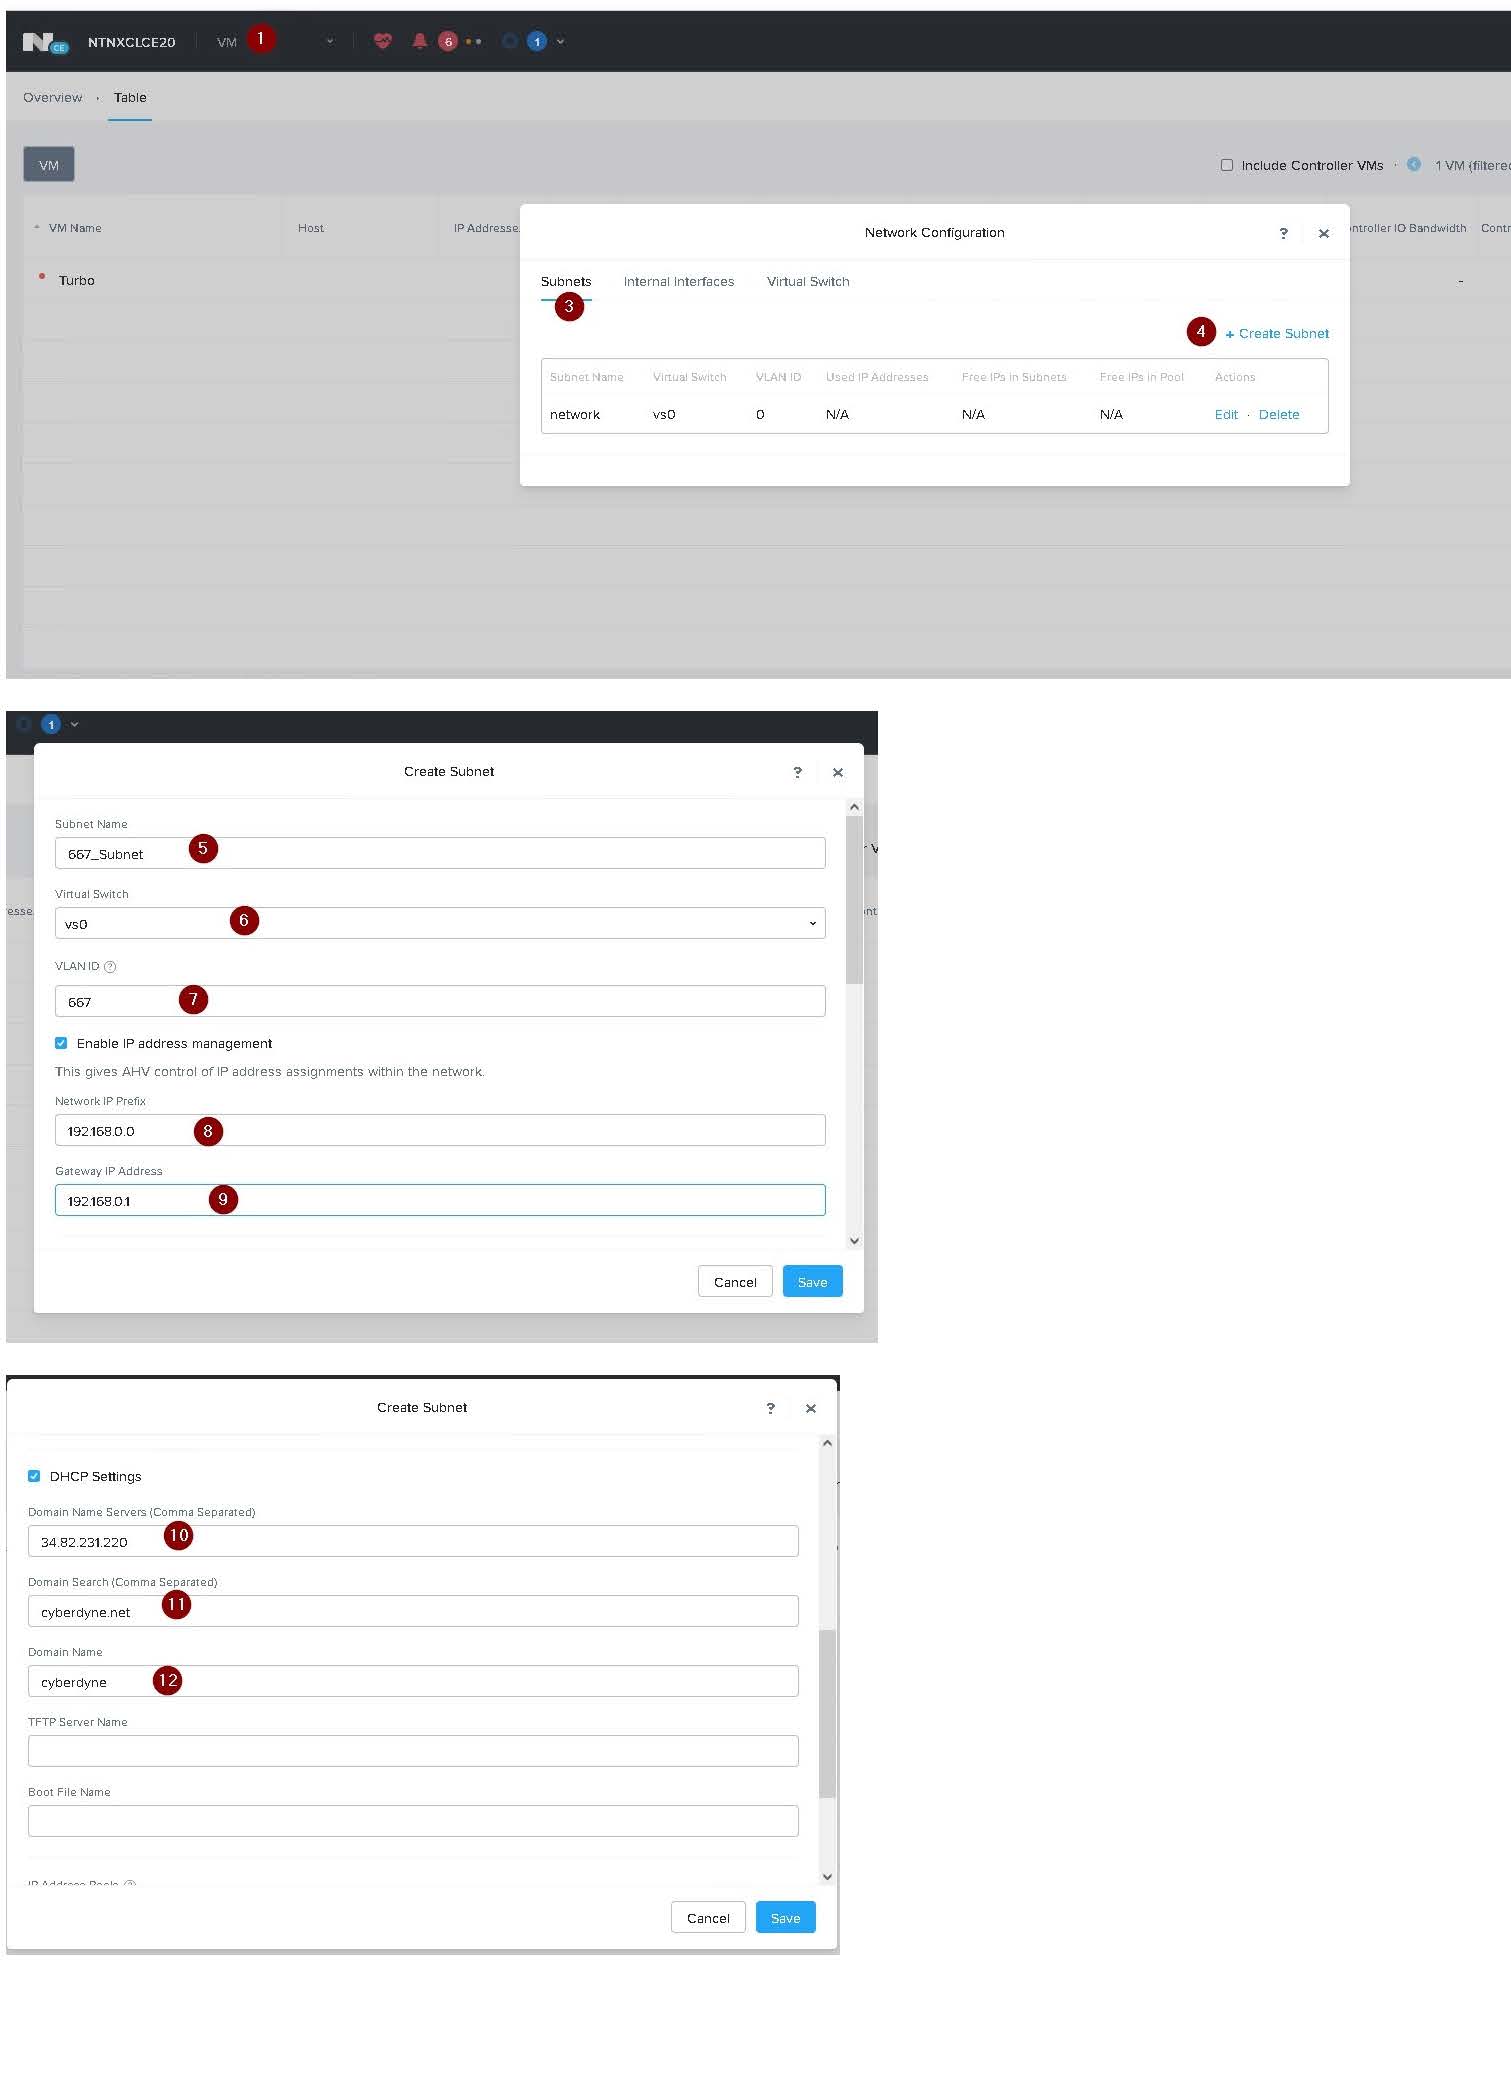
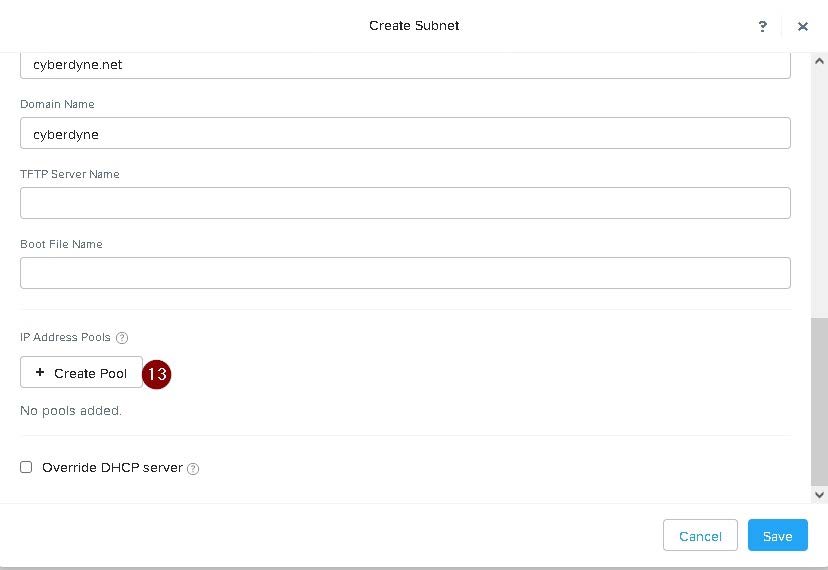
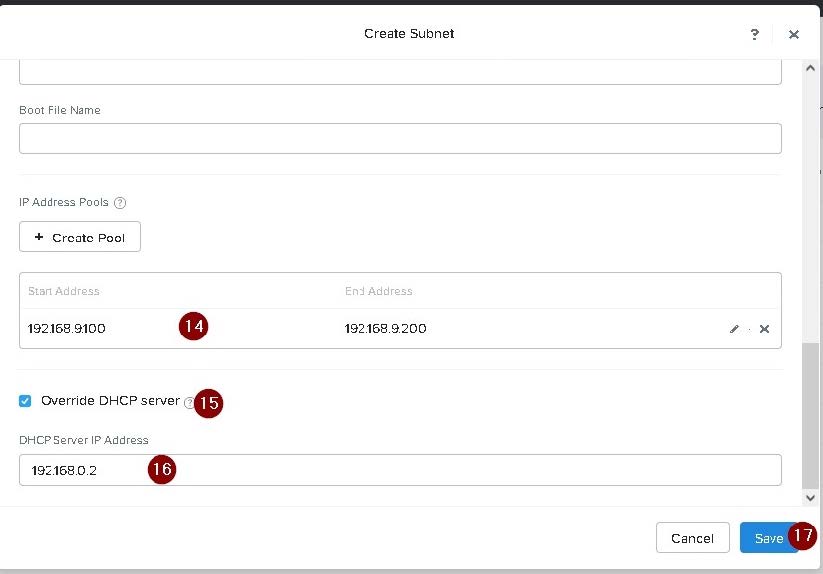
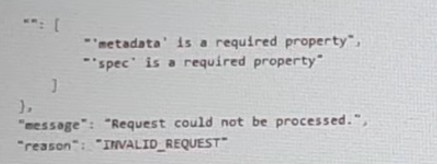
CORRECT TEXT Task 5 An administrator has been informed that a new workload requires a logically segmented network to meet security requirements. Network configuration: VLAN: 667 Network: 192.168.0.0 Subnet Mask: 255.255.255.0 DNS server: 34.82.231.220 Default Gateway: 192.168.0.1 Domain: cyberdyne.net IP Pool: 192.168.9.100-200 DHCP Server IP: 192.168.0.2 Configure the cluster to meet the requirements for the new workload if new objects are required, start the name with 667.
A. Answer: See the for step by step solution.
CORRECT TEXT
Task 1
An administrator has been asked to configure a storage for a distributed application which uses large data sets across multiple worker VMs.
The worker VMs must run on every node. Data resilience is provided at the application level and low cost per GB is a Key Requirement.
Configure the storage on the cluster to meet these requirements. Any new object created should include the phrase Distributed_App in the name.
A. Answer: See the for step by step solution.
CORRECT TEXT
Task 10
An administrator is working to create a VM using Nutanix V3 API calls with the following specifications.
*
VM specifications:
*
vCPUs: 2
*
Memory: BGb
*
Disk Size: 50Gb
*
Cluster: Cluster A
*
Network: default- net
The API call is falling, indicating an issue with the payload:
The body is saved in Desktop/ Files/API_Create_VM,text
Correct any issues in the text file that would prevent from creating the VM. Also ensure the VM will be created as speeded and make sure it is saved for re-use using that filename.
Deploy the vm through the API
Note: Do not power on the VM.
A. Answer: See the for step by step solution.
CORRECT TEXT
Task 2
An administrator needs to configure storage for a Citrix-based Virtual Desktop infrastructure.
Two VDI pools will be created
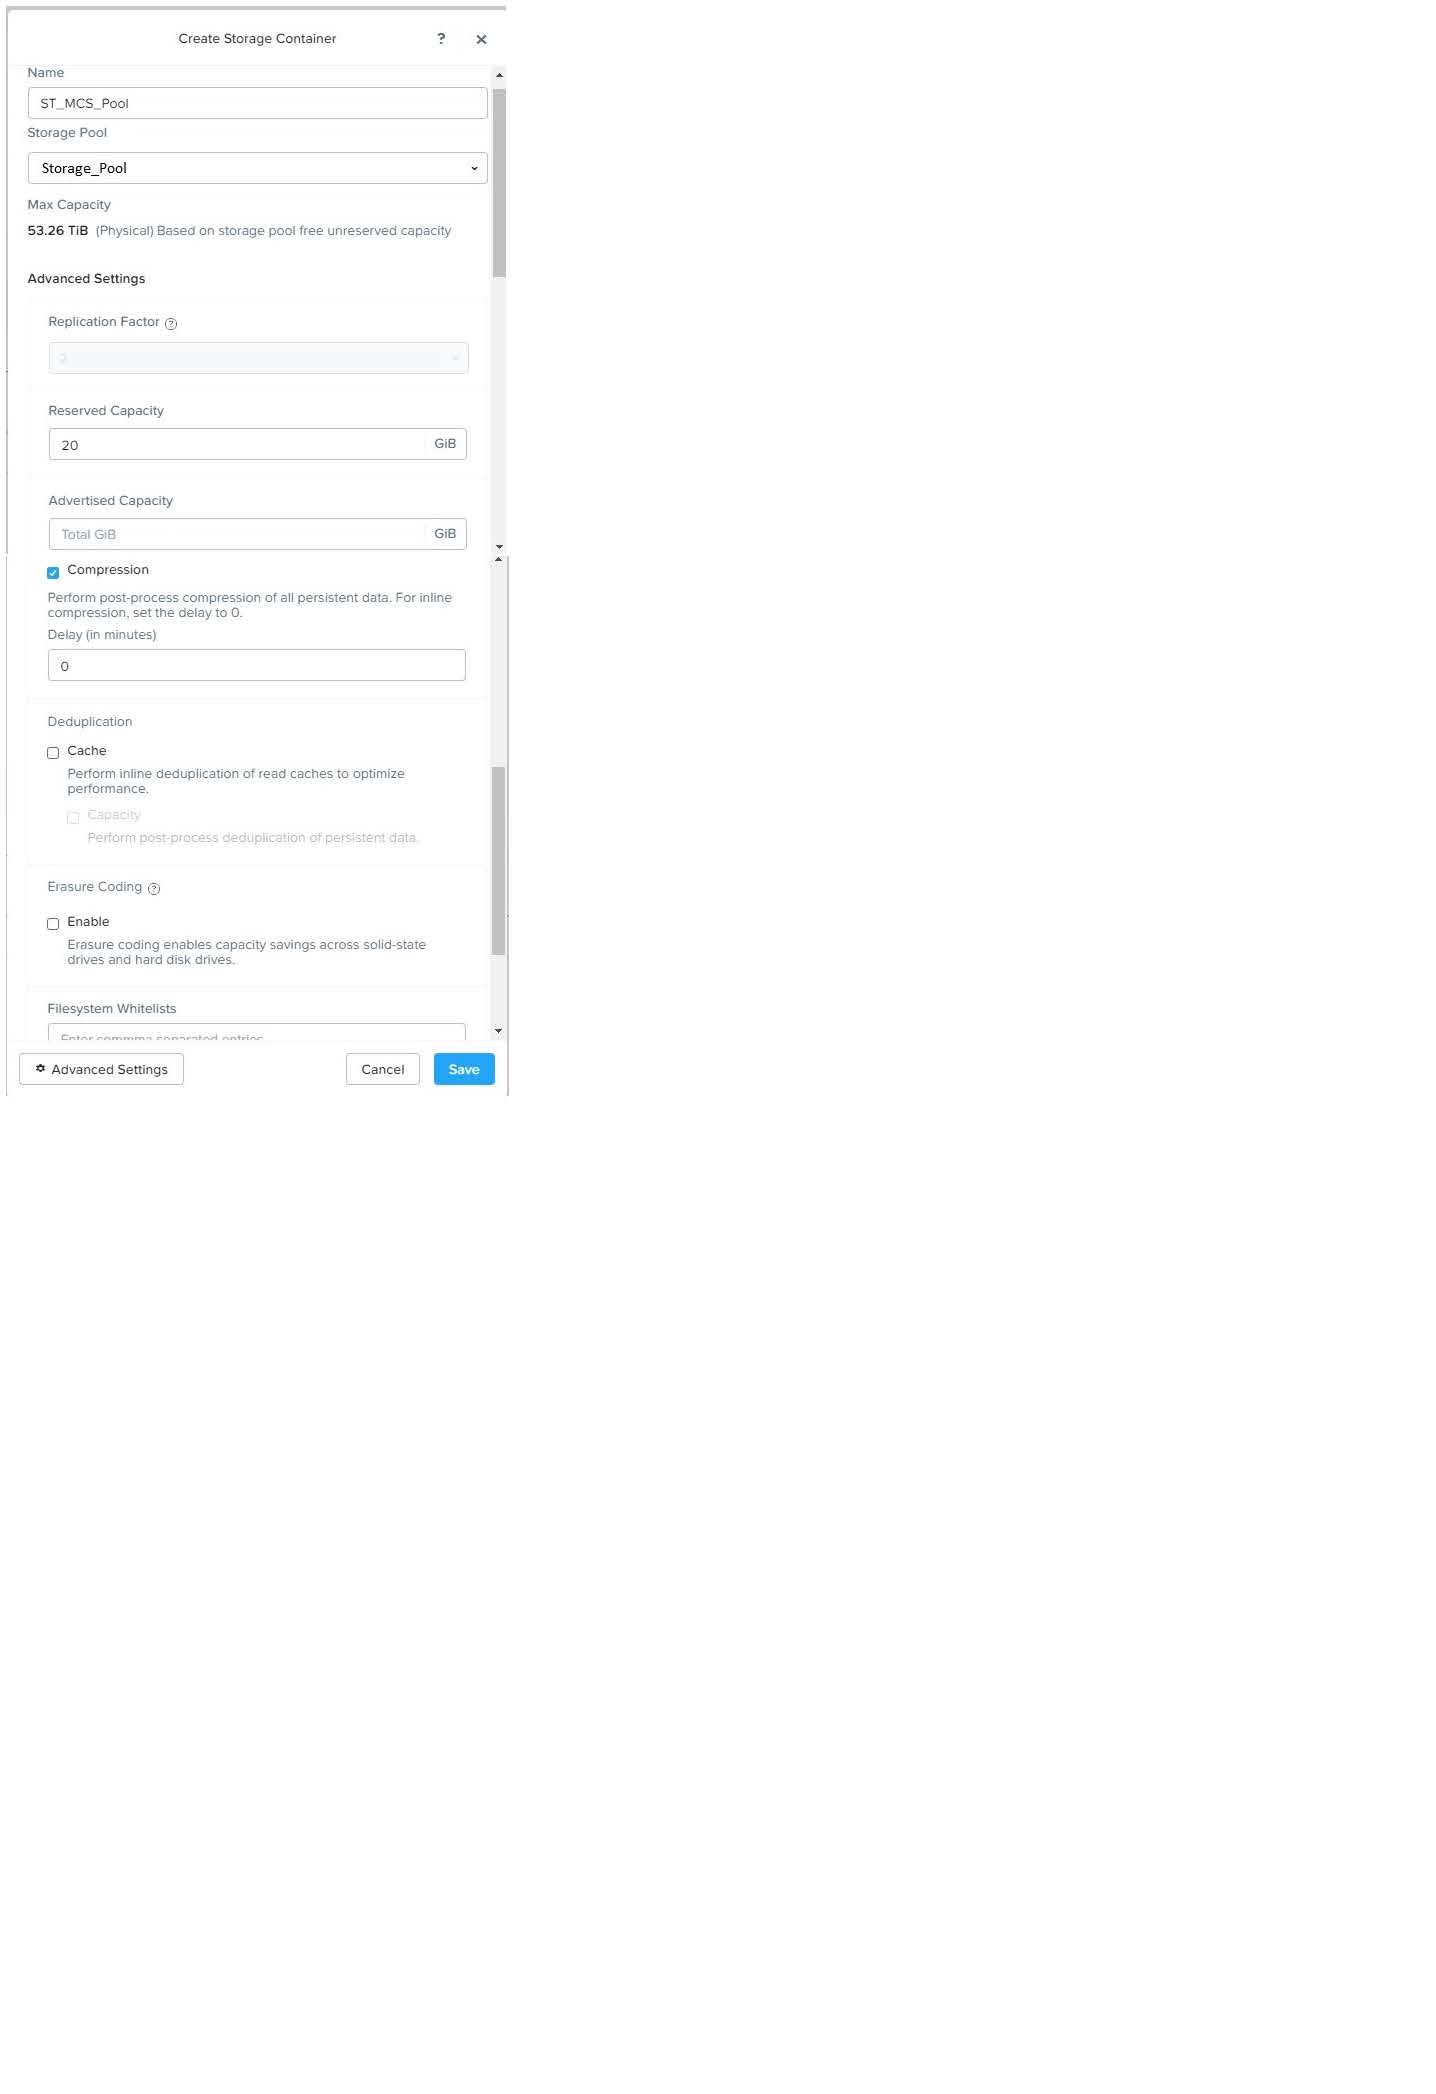
Non-persistent pool names MCS_Pool for tasks users using MCS Microsoft Windows 10 virtual Delivery Agents (VDAs)
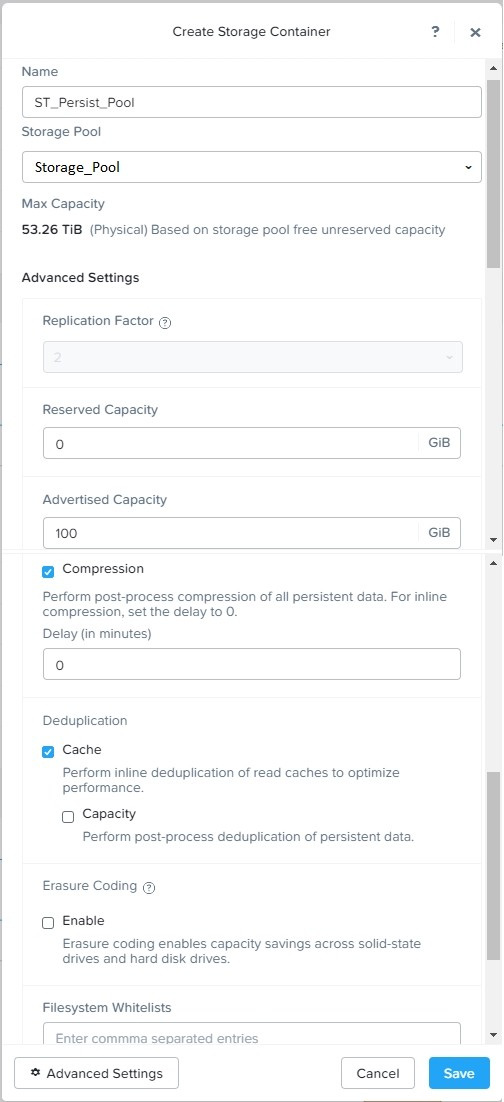
Persistent pool named Persist_Pool with full-clone Microsoft Windows 10 VDAs for power users
20 GiB capacity must be guaranteed at the storage container level for all power user VDAs
The power user container should not be able to use more than 100 GiB
Storage capacity should be optimized for each desktop pool.
Configure the storage to meet these requirements. Any new object created should include the name of the pool(s) (MCS and/or Persist) that will use the object.
Do not include the pool name if the object will not be used by that pool.
Any additional licenses required by the solution will be added later.
A. Answer: See the for step by step solution.